Make sure tasks have dates
Tasks only appear on the timeline if they have a start and end date. If a task isn't showing up, open it and add the relevant dates. Each task can also have an estimate (in hours), which feeds directly into capacity calculations for each team member.
Drag unplanned tasks to the Timeline
- To view all unplanned tasks, open the Unplanned Tasks sidebar
- Drag tasks to the Timelne to schedule them
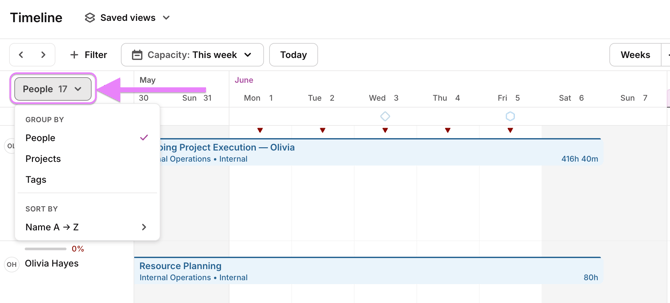
Switch between grouping modes
The timeline can be grouped three ways depending on what you need to see:
- By People — shows each team member's lane with their tasks and how much of their capacity is taken up. Useful for workload balancing and spotting who is over- or under-scheduled.
- By Project — shows all tasks organized by project.
- By Tags — organizes tasks by custom tags.
You can also add milestones for a quick overview of key delivery dates.
Understand capacity at a glance
When grouped by people, each lane shows a capacity percentage — how much of a team member's available hours are already scheduled. This is calculated based on their working hours (which can be customized per person, or defaulted to 8 hours/day) and the estimates on their assigned tasks.
Use task estimates consistently. When estimates are filled in, the capacity indicators become meaningful and the timeline becomes a reliable planning tool rather than just a visual list.
Toggl 2.0 also takes into account public holidays and time off, so you're always planning against realistic availability.
Customize your view
Adjust zoom level
You can adjust the zoom level to match your planning horizon:
- Week — ideal for day-to-day task scheduling and daily capacity checks
- Month — good for a rolling overview of team workload
- Quarter — useful for longer project planning and spotting future bottlenecks
Capacity percentages and indicators adjust automatically as you zoom in or out.
Factor in meetings and calendar events
If your team has connected their Google or Outlook Calendar, their meetings and events appear directly on the timeline. This means if someone has a heavy meeting day, you'll see that their available capacity is reduced — before you assign them more work.
Use filters
Filter by member, team, project, client, status, priority, or tags to focus on exactly what you need.