Filters
Start by narrowing down what you want to see. You can filter by:
- Time period — choose any date range
- Member, client, project, task, status, and priority — combine multiple filters to get to exactly the data you need
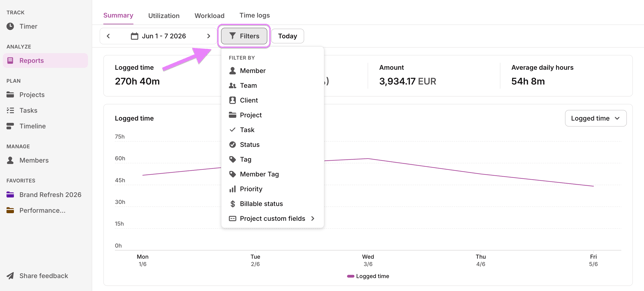
Overview metrics
At the top of the report, you'll see a summary for the selected filters:
- Total logged hours
- Billable time and amount
- Non-billable time
- Average daily hours
Charts
Use the dropdown above the main chart to switch between two views:
- Logged time — see total hours tracked across the selected period
- Billable vs. non-billable time — see how tracked hours break down between client work and internal work. Hover over any bar to see the exact split for that day.
This is especially useful for teams tracking profitability or reporting to clients.
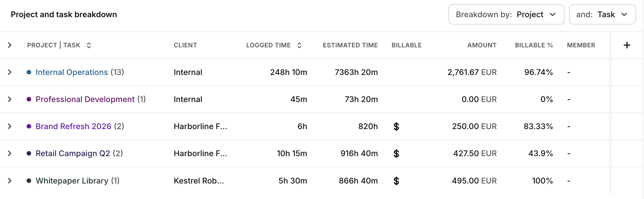
Breakdown table
Scroll down to see a detailed breakdown table. You can sort by two dimensions at once for an in-depth view.
For each project or task, you'll see:
- Whether it's marked as billable
- Billable percentage
- Billable vs. total time
- Total project billable amount
- Project total estimated time
- Region
Note: If billable data isn't showing, check that time entries in your workspace are marked as billable.