Overview
Project Dashboards provide a real-time view of project progress, time tracking, and forecasting. The feature is designed for projects that have tasks and time tracking data associated with them.
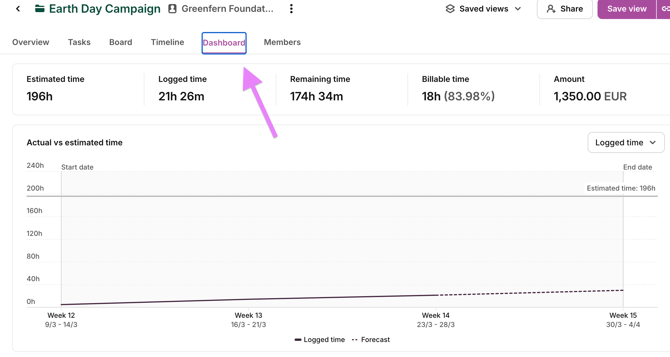
To access Project Dashboards, navigate to Project Dashboard tab under a project.
Dashboard Components
Time Tracking Metrics
- Time budget chart with a forecasting line
- Estimated time — The projected total time for the project
- Logged time — Actual time tracked against the project to date
- Remaining time — Calculated time left based on estimates
- Variance — Clearly indicated difference between estimated and logged time
Project Timeline
Each project displays a start and end date, which is factored into progress calculations and forecasting.
Forecasting
The dashboard includes a dotted line forecast that projects future time tracking based on current logging patterns. The estimated end date updates dynamically as more time is tracked, giving teams an up-to-date view of when the project is likely to wrap up.
Breakdown Views
Users can analyze project data through three lenses:
- Task breakdown — View progress and status at the individual task level
- Member breakdown — See time allocation and contributions per team member
- Status breakdown — See tasks under a certain status, and time tracked towards the tasks
Recurring project dashboards
The recurring project dashboard brings period-level financial and time metrics into one view for recurring projects.
What the dashboard shows
The dashboard groups data across all periods within a recurring project. Periods are displayed in ascending order, with period 1 at the bottom. Each period includes:
- Revenue
- Cost
- Profit margin
- Time variance
Above the period-level breakdown, the dashboard shows an overview of the totals per project and below the period breakdown, margin percentage week-over-week.
Requirements for margin calculation
For project margin to be calculated correctly, the recurring project must be configured with:
- either a fixed fee or a billable rate
- cost
If a recurring project does not have a rate or fixed fee configured, margin will display as zero. It does not go negative in that case.